Funnel and pipeline reports
Where to find the Reports hub, how to read the funnel and pipeline numbers, switch periods, and download a report as CSV.
Reports live under Library → Reports. They are built on your live CRM data — the moment a deal closes or a payment is recorded, the numbers change. Access requires the Reports & Insights permission of your role; without it the page shows "You don't have access to reports."
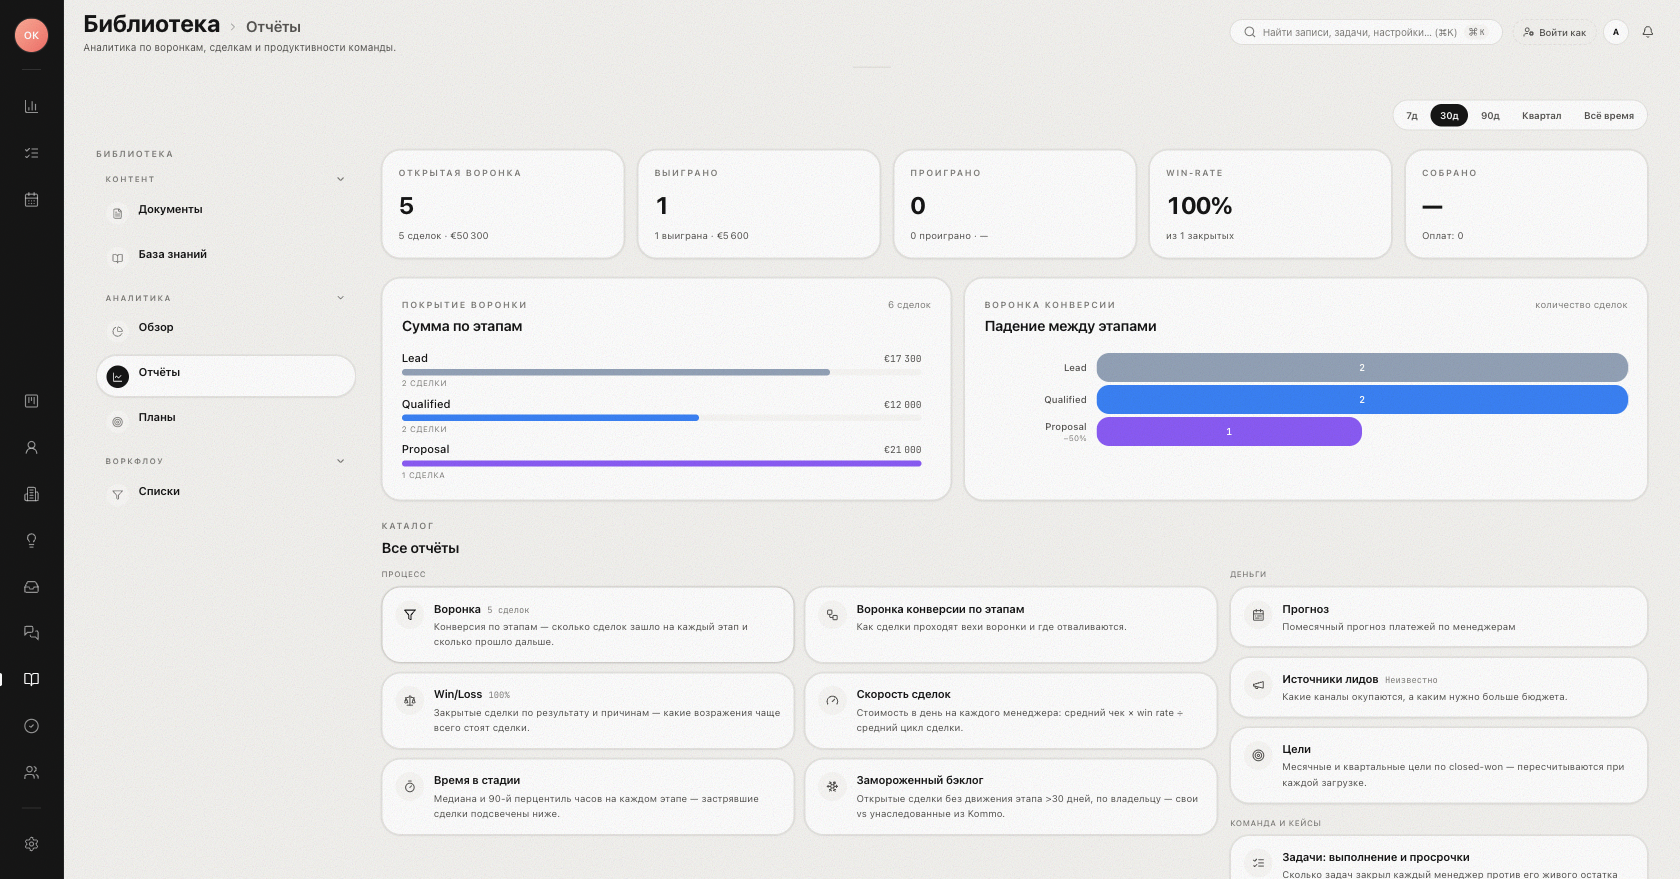
The Reports hub
The hub opens with five KPI cards for the selected period:
| Card | What it counts |
|---|---|
| Open pipeline | Open deals and their total value |
| Won | Deals closed as won, with a change vs the previous period |
| Lost | Deals closed as lost |
| Win rate | Won share of all closed deals |
| Collected | Payments actually received |
Below the KPIs sit two charts: Value by stage (how much money sits in each open stage) and Stage-to-stage drop-off (deal counts shrinking through the funnel).
Period filters
The hub and the team pages (Sources, Tasks, Leaderboard, Meetings, Communications) share the same period tabs in the top-right corner: 7d, 30d, 90d, Quarter, All time; the default is 30 days. A few reports use windows that fit their metric instead: Win/Loss offers 30, 90, and 365 days plus all time (default 90), Velocity offers 90, 180, and 365 days plus all time. Pages such as Funnel, Forecast, Goals, or Time in stage have no period tabs at all. Wherever tabs exist, the period is part of the URL, so you can bookmark or share a filtered view.
The report catalog
The All reports section groups the drill-down pages:
- Process — Funnel (per-stage entered / progressed / conversion %, with a pipeline switcher), Stage conversion funnel, Win/Loss with loss reasons, Velocity, Time in stage (median and p90 hours per stage plus stuck deals), Frozen backlog.
- Money — Forecast (payments by manager and month), Lead sources (attribution and cohort conversion), Goals.
- Builder — Custom report: pick a metric, a group-by, and a window to get a chart and a table.
Two pages have their own gates: the Tasks report requires the analytics permission of your role, and the Cases page appears only when your role can view cases.
Exporting to CSV
Tabular reports — sources, forecast, win/loss, stage conversion, tasks, frozen backlog, and the team analytics pages — carry an Export CSV button. The download:
- requires the report export permission on your role;
- reuses the exact query behind the page, so the file never contains more rows than you can see on screen;
- is named after the report, the date, and the active filter (for example, sources_2026-07-05_30d.csv).
All report numbers respect your visibility scope. A manager scoped to "own" sees their own funnel; leadership sees the whole workspace. See the category page Reports & insights for the other analytics articles.
Was this article helpful?